
I had the privilege of attending the 2008 Boulder summer school on strongly correlated materials.
It is the tradition of the school that the attendees develop a t-shirt related to the topic of the year.
Specially in that year, Leo Radzihovsky (then site coordinator) was concerned about the time: 3 weeks instead of the usual 4 weeks.
He then delegated the responsability to 2 of his “multi-task” grad students (Sungsoo Choi and Quan Zhang) to rush and to help people to come up with nice designs, bring them up, and then vote on the best choice. They were of essential help for me. Not only in this matter, but also for other things during the school.
Fortunately, Rafael Fernandes (another school attendee and great friend of mine) pushed me to try something. I confess I was not excited with the idea and probably wouldn’t do anything if he didn’t insisted. His strategy was to say that nobody was moving, so we wouldn’t have a t-shirt due to the lack of designs. (He was wrong, but the strategy was right… We were surprised with the number of designs that appeared in the end.)
Ok, then I decided to try something. My first idea was to bring people together to try something like a “brain-storm”. We would put many key-words altogether and hopefully come up with some idea that would bring the topic (strongly correlated electrons) and Boulder together.
In one of the lunch times, we were successful in doing that. People were shy because they didn’t know how to draw. But them they realized that what is important is the idea. The drawing could be easily done by me. The whole point was that we were acting like a group, many people were involved: Rebecca Flint, Ingrid Bausmerth, Darya Aleinikava, Marianna Maltseva and others that I will cite below (and others that I certainly forgot).
We then came up with many ideas. One of them were electrons climbing a mountain. On the bottom, they were particle-like while on the top they acquired a wave-like character depicted by an uncertainty electronic cloud. On the peak, a flag written “Fixed Point”.
Another idea was electrons riding a bike with many seats. The chain of the bike was made of a spins (a spin chain… I know, lame). (I remember people liked this one when I drew the electron wearing a cap turned around like daredevil kids usually do.)
Other ideas appeared but I don’t remember the details. One that we decided to try was mainly by Elena Hassinger. The idea was to draw a phase diagram like the usual ones for 2nd order phase transitions in the H versus T plane. The ordered phase was represented by a mountain like the one we have near Boulder campus (the Flatirons). The quantum critical point was represented by a building depicting the Colorado University and the quantum-classical disordered phase crossover region was depicted by an airplane bringing the attendees to the school (see Fig. below).
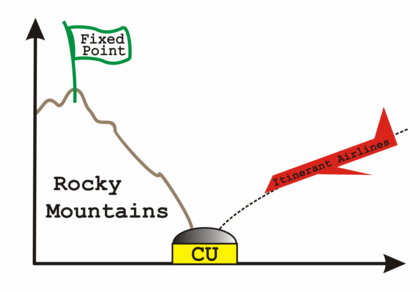
I was happy with this design because of its simplicity. It could easily fit in the t-shirt chester like a small logo. But we still needed a major design for the back of the t-shirt. (Later at night, Rafael drew it very rapidly with my help using one of the Windows program for drawing, photoshop, maybe - I don’t remember.)
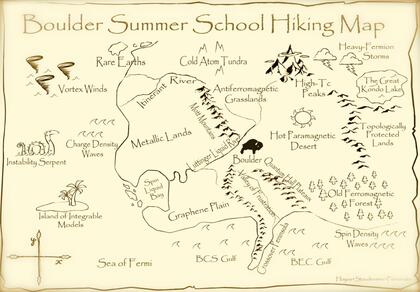
At the end of the same lunch time, I was then drawing other phase diagrams, but this time more like in 3D. I then drew a mountain range followed by some hills. This was supposed to represent the cuprate superconductors phase diagram. The mountains were representing the AFM phase and the hills the superconductor dome. In the middle, “Strange lands” regarding the strange metal phase between those two.
Then I decided to draw a pine-tree-like forest around and call it Ferromagnetic Forest. Funny that I didn’t realized I was drawing a map at that moment.
Instead, I had another idea. Why not draw a city?
I could use the many essential parts of the city to play with. For instance, the cemetery would be called “Cemetery of Dead Theories”. I imagined something like a street with many kinds of restaurants. The McDonald’s would sell “Heavy Electrons”. Itinerant airport is another idea. We could play with other usual things in the city like the City Hall, Cinema, Parks, Mountain in the background (you know, Boulder)… Each one would represent some part of the vast world of strongly correlated systems. It was clear to me that the idea of having cooperative electrons wouldn’t be able to capture this huge world.
Later that night, I decided to do pursue the idea of the city. I started drawing but then realized that things are not easy. Too many details like small streets, buildings and houses. So I looked in The Simpsons web site to see how they managed that. Very simply, you can navigate throughout Springfield. An option that we don’t have in nowaday t-shirts.
So I decided to draw the AFM mountains and the superconductor hills again. Suddenly, I drew some rivers and seas. Only then I realized that I was drawing a map. This seemed to me a good idea. Each geographic accident would represent a field in the strongly correlated field.
Rafael enjoyed it and gave me support.
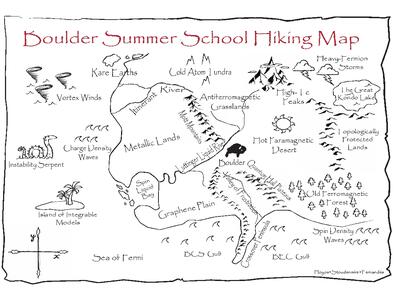
In the next days, I then dedicated part of the free time to draw the map. Drawing with pencil is easy, but I needed somehow to convert it into bits. The first idea was to scan it. Sungsoo and Quan were very helpful on that. Also, I needed to make it darker. Pencil does not go fine on scanner. Fortunately, Lara Thompson had good pens for that. So sharp that the thickness was about 0.8mm. (Thanks Lara!) So the final result is in the picture below. (Somehow the scan cut part of the figure.)
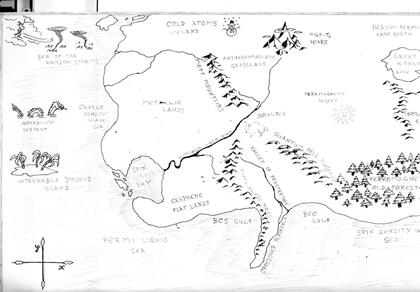
At this point I was worried about the global aspect of the map. Should I make it more serious or more cartoony? The Integrable Models Island and the snow-man in the Cold Atoms Iceland were clearly cartoony. The Instability Serpent and the Sea of Random Storms were intermidiate since figures like that appeared in old maps. The Compass Rose I decided to leave as an x versus y graph instead of the usual North-South-East-West one.
The day for presenting the t-shirt design was coming, and I was not happy with the above result. It couldn’t go on the t-shirt like this. So, in a desperate moment, I decided to draw it directly in the computer. I then used, in an even more desperate moment, the Windows Paintbrush. (Kids, don’t do that without the supervision of an adult!)
It took me lot of my weekend to draw it (fortunately, I didn’t go for very long hikings that weekend).
The idea of having a name for the map came together with my speech in the voting day to convince people that the map was a good one. “We are here to hike… ops! To study! But eventually, we may hike in the mountains. So, we need a map. And that’s the map I found in the library!” The idea was that all topics covered in the school were somehow represented in the map. Moreover, all the problems the attendees were working on should be in the map. At the end, I made another joke. “No other school had a map as a design for the t-shirt. We would be the first one. Also, this idea covers many fields in physics. So, we fulfil the PRL criteria of originality and broad audience, and therefore, this design should be published!”
In the voting day, many other designs appeared. Around 10 different ones. Many of them very nice. Fortunately, the map was the most voted one.
It was then decided that the final design would be responsability of myself, Miles Stoudenmire and Rafael. Miles had produced another design that was voted a lot: Two electrons in a hot tub. Many symbols like the wave function Psi and Dirac’s bra and kets where hidden.
He used the drawer of the Acrobat and volunteered to help me with the final version of the map. (Thanks a lot, Miles!!!)
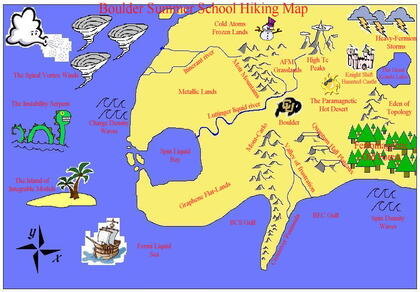
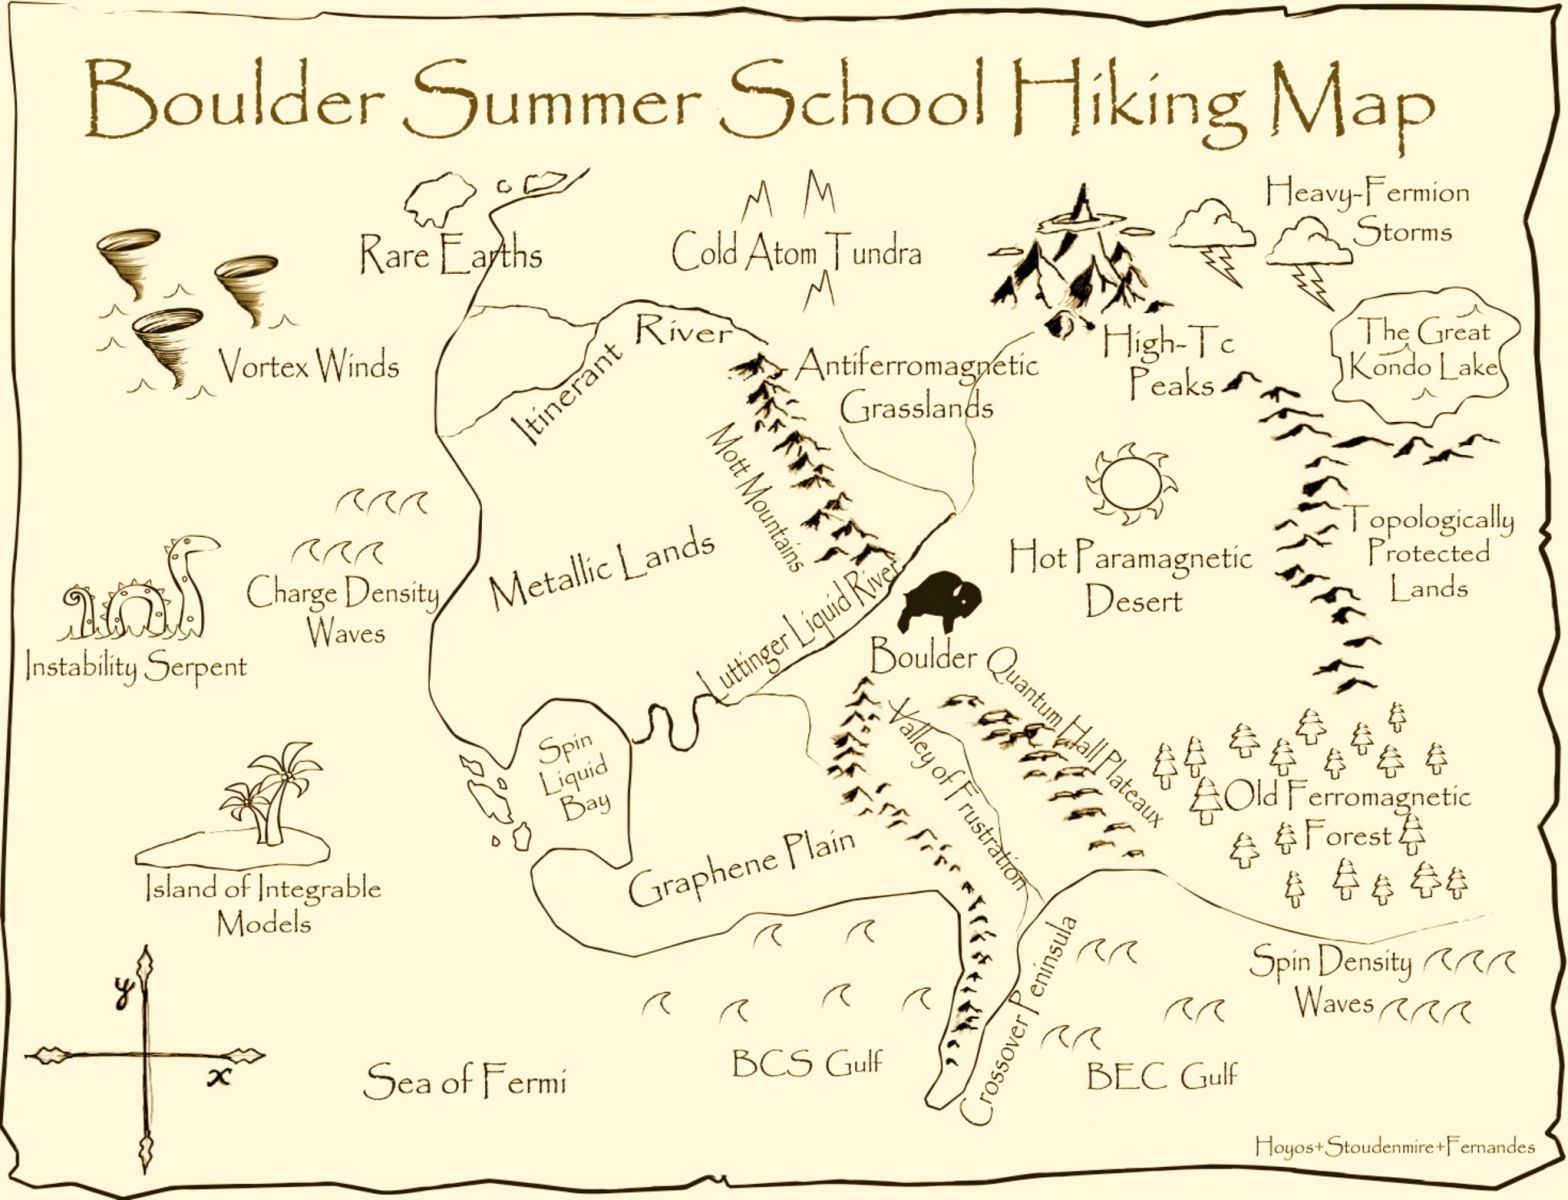
So, in the same day at night I was bugging Miles and Rafael to help me with the final design. This program, the drawer of the Adobe, is awesome. So many resources and friendly. I was very impressed. Miles helped me a lot with many of the drawings: The Serpent, the Sun and the Buffalo. Also, it was his idea to make the wave-pairs faraway in the BCS Gulf and closer in the BEC Gulf. He also cut the mountains from the scanned file I drew by hand. Drawing and shading them on the Adobe drawer was too painful.
The final result was more or less like below (for better visualization, get the .pdf file).
I spend lots of time that night to get near the final version. I even lost the cellebration of Taylor Hughes’ birthday. (Sorry Taylor, I called Daniel and Luke to know where you guys were, but they didn’t answer the phone. Their fault! :) )
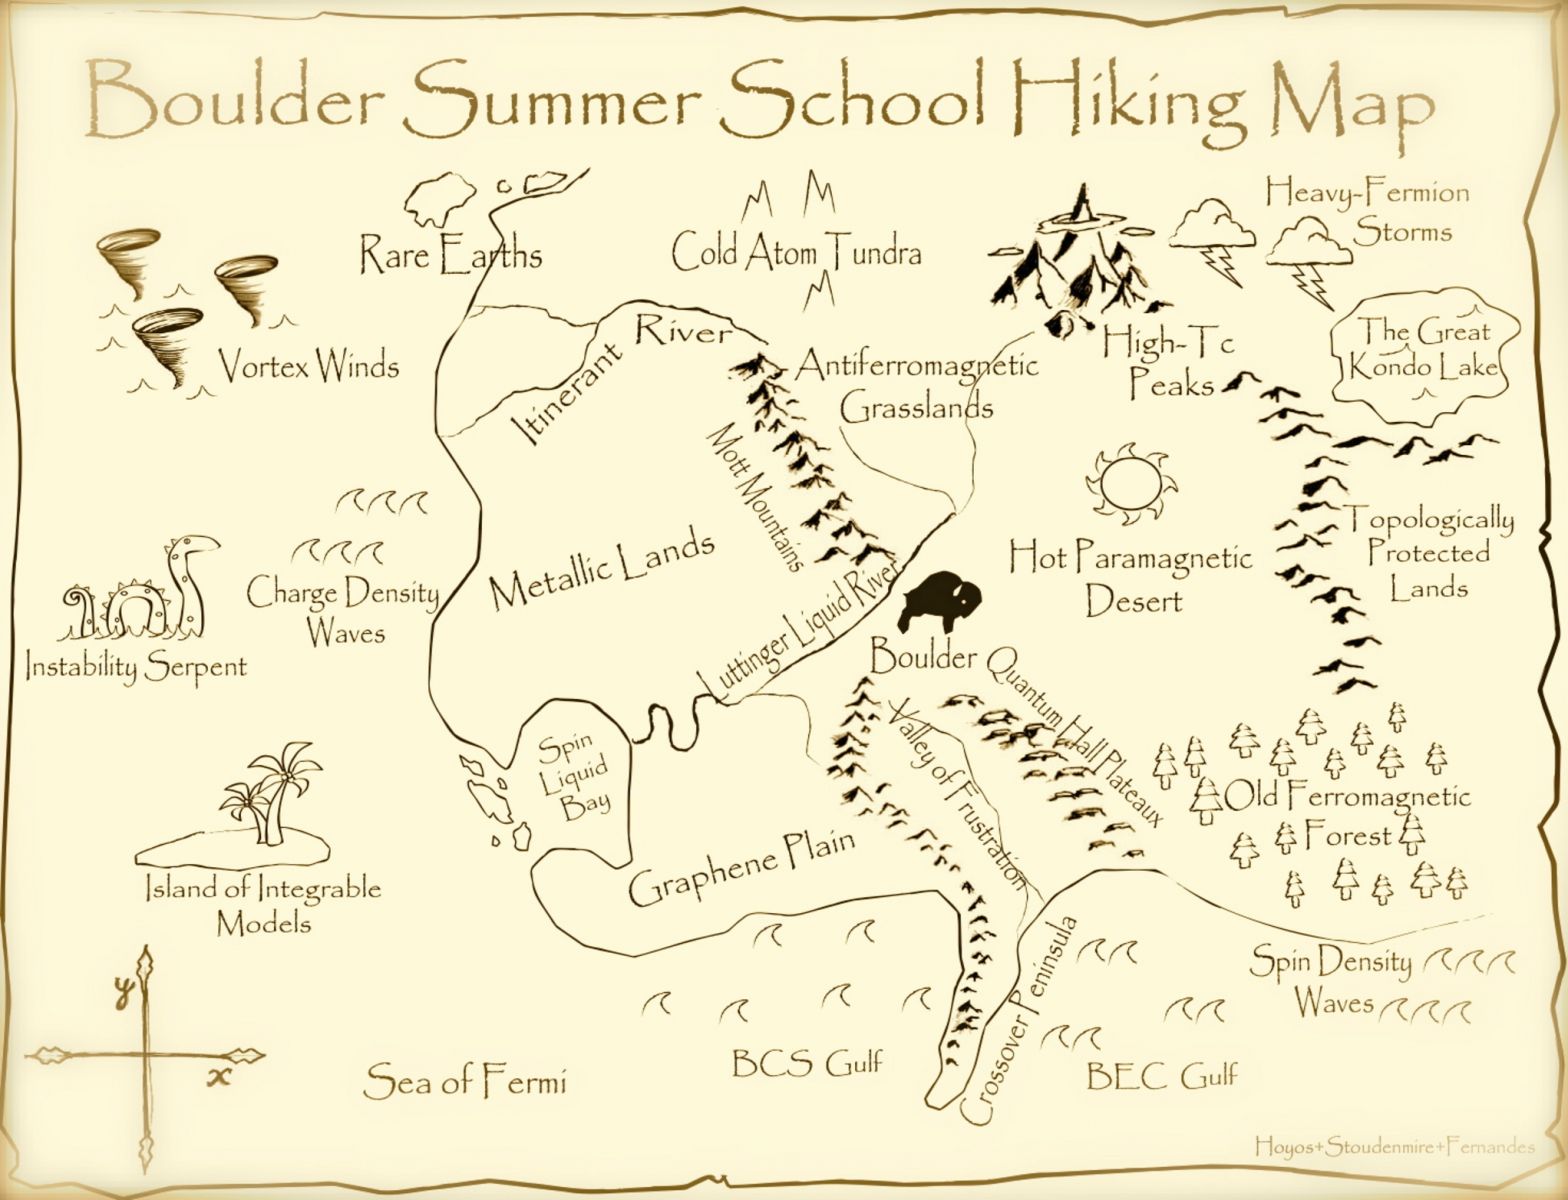
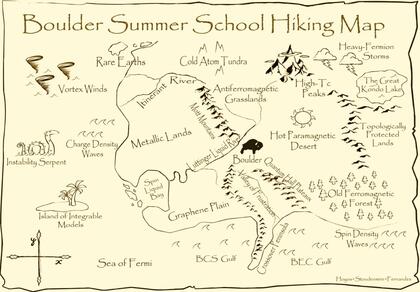
At the end, I got many response from everybody. Vladimir Cvetkovic and somebody else had the idea of putting a frame on the map. One of those in which the ends roll over itself. I then put like as in the picture, so it would look like an old parchment.
It was very nice to see many other peoples trying to collaborate. That was exactly my intention. A design of everybody. Robert Beaird, for instance, had the idea of making a treasure-hunt like map. Leo have the idea of the city, but instead of having a ficticious one, Boulder would be featuring in the map. Jila and Gamov towers as well as The Sink would be very easily drawn and representative. I really appreciated that idea, but, as before, I decided not going along with that because of the lack of time. A good job would take another week. Maybe this idea can fit in a future school.
I would like to thank Ion Garate for helping with some names in the map. (You know, English is not my mother tongue. I think it is neither his…)
Also, I would like to thank Judit Romhányi for helping me with the final color. I really appreciate the final design (see also the .pdf files: color and color+blur). She used some program in her Mac.
In concluding, it was very fun to draw this map. (Except for all the trees in the FM old forest in the original scanned file I drew by hand. It was very painful.) Much of it has the cartoon picture we build about the various phenomena. I would like to discuss the physics involved and how/why each part of the map is like/where it is, but I believe it is better to leave it for each one’s imagination. Also, one can create its own mithology and legends in this world. (Like renormalization group fishes that only flow/swin away from critical waters… ok, enough of lame things.)
I hope this small diary can give further motivation for those in future Boulder schools engaged on this nice activity of designing a t-shirt. As you could realize (I hope), it can engage a large number of people and be very fun.